 Ashigrain
Colour reversal · 2000–2005
Fujifilm Provia 400F
Fine-grained slides at daylight 400.
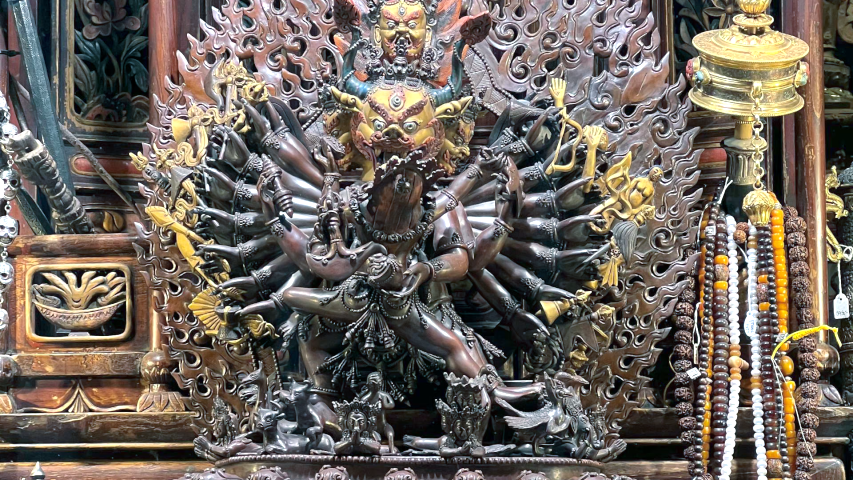
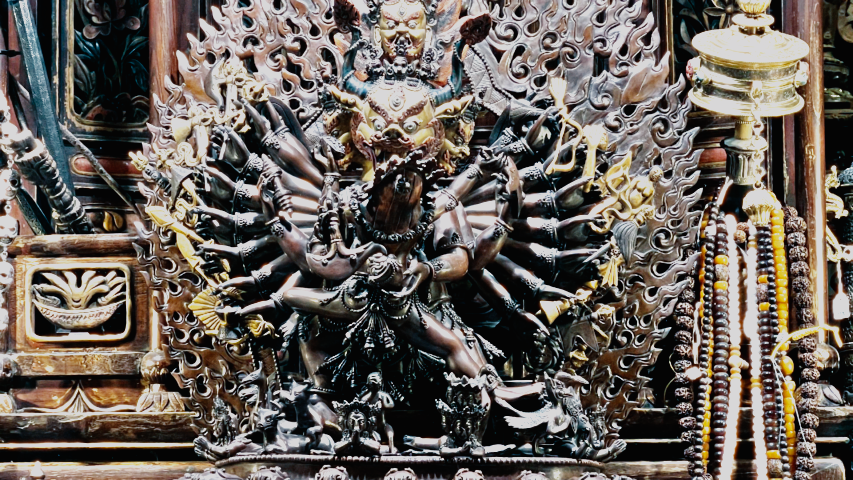
Fujifilm Provia 400F in Reversal mode. Original vs Ashigrain.
At a glance
- Exposure index
- 400
- Daylight
- Introduced
- 2000
- Discontinued
- Process
- E-6
- Prints on
- Reversal, viewed directly
About the film
Fujichrome Provia 400F Professional is a daylight ISO 400 colour reversal film with the code RHP III. Fujifilm's research paper says the company released Provia 100F and 400F in summer 2000.
The maker presented them as a new fine-grain generation of reversal films. Fujifilm listed news, sports, model, fashion, landscape and product photography among 400F's professional applications. Its data sheet gives compatibility with E-6, Fujifilm CR-56 and Fuji/Hunt C6R processing. It lists 135, long rolls and 120 on cellulose triacetate, with an RMS granularity headline of 13 under the stated measuring conditions. Fujifilm announced Provia 400X as its replacement in February 2006, explicitly naming 400F as the predecessor. Provia 400F is discontinued, but that announcement does not independently date the last coating or sale of the F film.
Sources for this history
- FUJICHROME PROVIA 400F Professional [RHPIII] Data Sheet, FUJIFILM Corporation
- Development of Super High Image Quality Color Reversal Films FUJICHROME PROVIA 100F and 400F, Fuji Photo Film Co., Ltd. (Hideo Ikeda et al.)
- Fujichrome Provia 400X Professional Film (Fujifilm press release), Photography Blog, reproducing Fuji Photo Film U.S.A., Inc.
The look
Fujichrome Provia 400F is a daylight ISO 400 slide film, coded RHP III, for E-6 or compatible Fujifilm processing. Fujifilm offered it for news, sport, fashion, landscapes and products. It defaults to Reversal mode, with grain modelled from its own net-density RMS 13 headline.



Best for
- News and sport in daylight
- Fashion work needing 400-speed film
- Landscape and product slides
Compare camera films
Science & sources
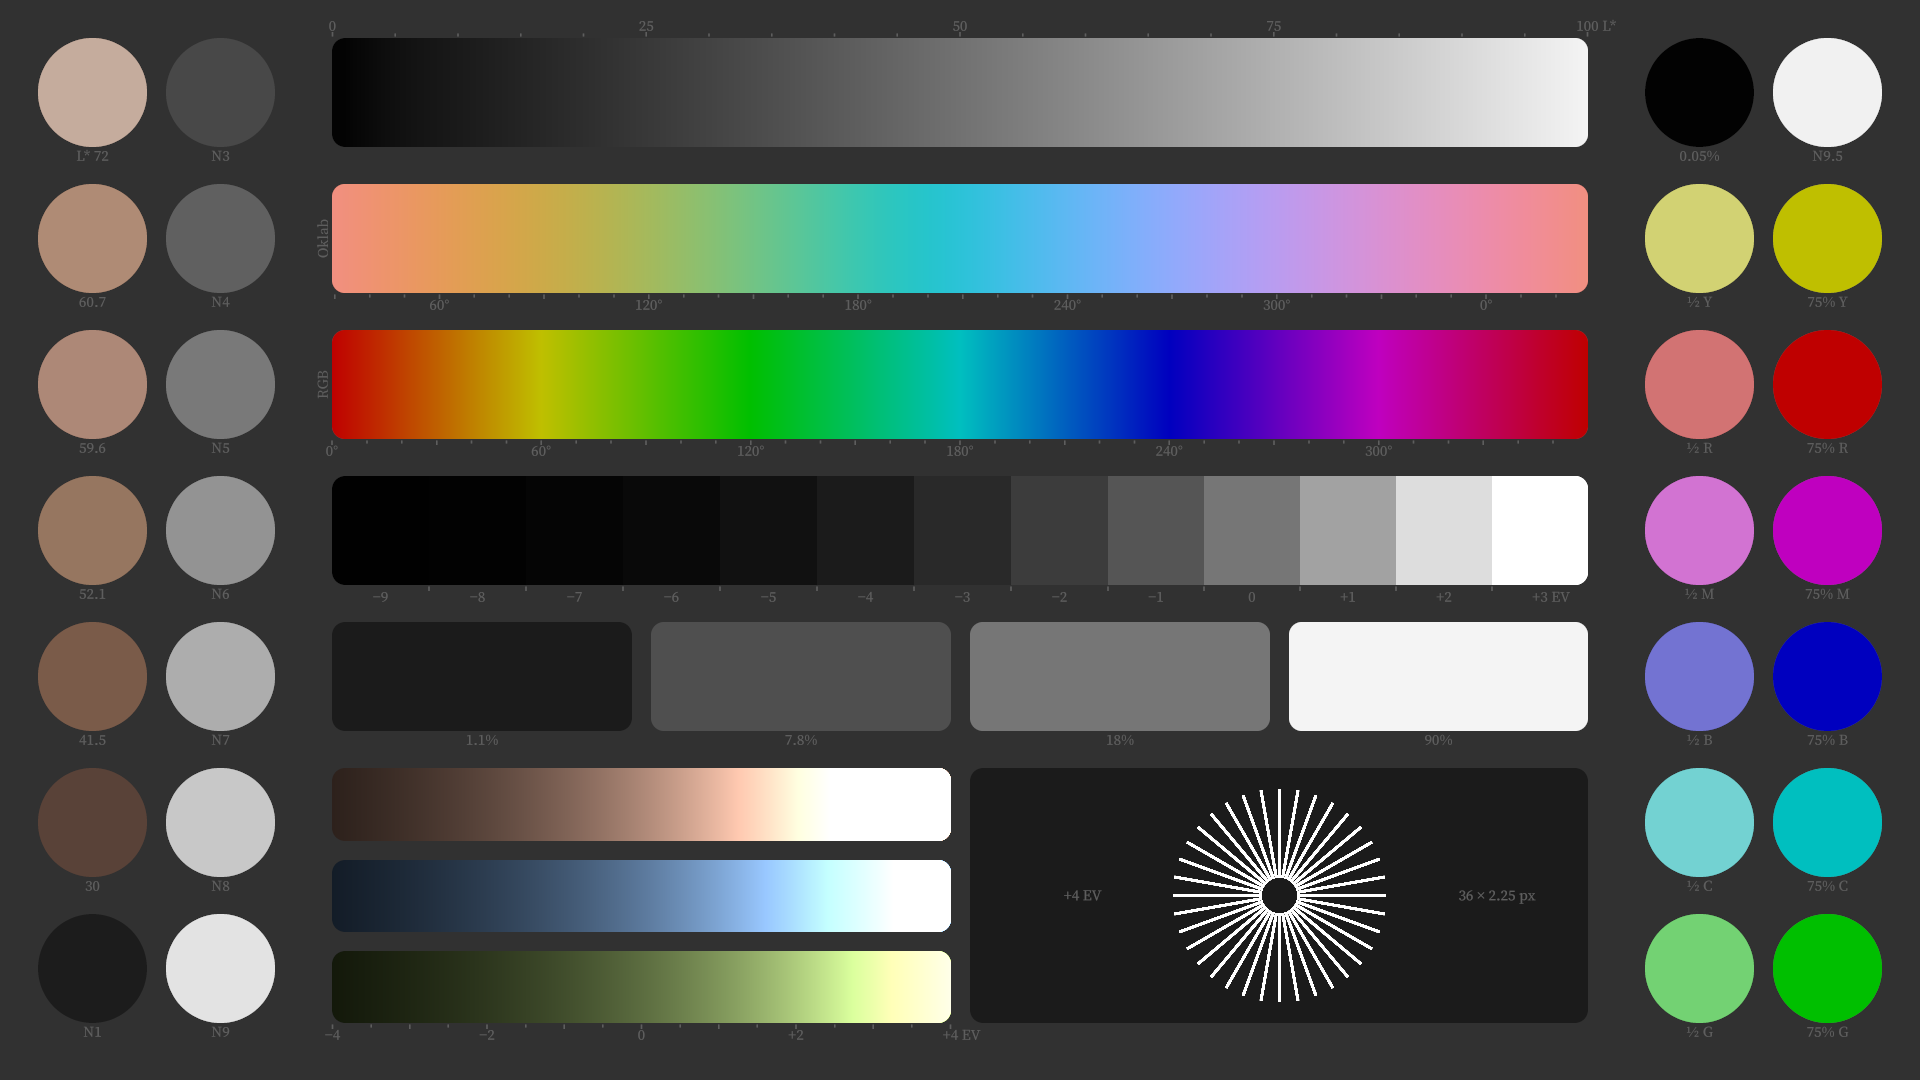
Its tone, sensitivity and individual dye spectra come from Fujifilm's AF3-066E sheet. A single MTF curve is used on all layers, the coincident green and blue tone tails are completed from red samples, and the reversal base spectrum is assumed. Grain uses its own net-density RMS 13 headline; push processing is generic.
Response curves and the evidence behind the model
Compare manufacturer data with Ashigrain’s response on the same axes. These curves show how the model is calibrated to its sources; they do not establish a match to photographed film.
Characteristic response
RMS granularity
Density variation (σD) measured through a 48 µm aperture. Where the datasheet gives a single grain value, the response away from that point is an approximation.
| Channel | Density | Datasheet-based σD | Model σD |
|---|---|---|---|
| R | 0.3 | 0.00696 | 0.006889 |
| G | 0.3 | 0.004809 | 0.004766 |
| B | 0.3 | 0.008276 | 0.008182 |
| R | 0.6 | 0.013752 | 0.013612 |
| G | 0.6 | 0.009935 | 0.009847 |
| B | 0.6 | 0.019571 | 0.01935 |
| R | 1 | 0.020668 | 0.020457 |
| G | 1 | 0.016784 | 0.016634 |
| B | 1 | 0.032791 | 0.032421 |
| R | 1.5 | 0.0308 | 0.030486 |
| G | 1.5 | 0.025582 | 0.025354 |
| B | 1.5 | 0.05216 | 0.051571 |
| R | 2 | 0.03538 | 0.035019 |
| G | 2 | 0.033496 | 0.033198 |
| B | 2 | 0.071102 | 0.070299 |
Model limits
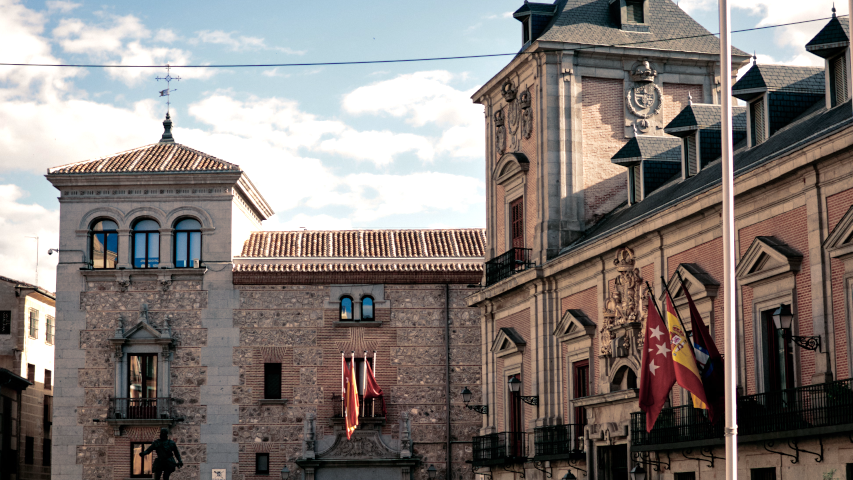
These images show the film model in use. Spectral response, lighting and viewing conditions include approximations. Halation, bloom, grain size, weave and flicker are not fully measured for each film. The look of real film also depends on development and print timing.
- Custom lighting spectra, camera metering and the spectral reflectance inferred from fixed-white-balance footage are assumptions used by the model, not measurements of this film.
- Conversion-filter spectra (80A for daylight films under tungsten, 85 for tungsten films in daylight) come from separate measured filter data, not from this film’s source. Applying those filters to this film remains modelled.
- The source publishes only RMS granularity 13 × 10⁻³ at net visual diffuse density 1.0, measured with a 48 µm aperture. Its response at other densities is modelled with a square-root density law.
- The sheet prints separate cyan, magenta and yellow dye spectra but no neutral or minimum-density spectrum. The reversal base-density spectrum is assumed.
- The green and blue characteristic tails meet the red curve at log H −1.4379. Their shared tail is completed with coincident red-curve samples rather than independent green and blue measurements.
- The source prints one visual MTF curve, not separate red, green and blue curves. The model applies it to all three layers.
- The MTF chart ends at about 69 cycles/mm; higher-frequency behaviour is not measured.
- The sheet describes −½ to +3 stops of push/pull, and up to +3½ stops for suitable subjects, but prints no pushed curves. Push and pull use a generic model.
- Reciprocity uses the p.3 daylight free range ending at 32 s, not the separate 64 s fluorescent-light instruction on p.2.
- The sheet prints reciprocity corrections at a few exposure times; the correction between them is interpolated, and the colour-compensating filter it prescribes is taken at its nominal value.
- The printed MTF rises above 100 %, which the model renders as a development adjacency effect. Its width, amplitude and dependence on density and development are not published and are approximated.
- The adjacency fit uses two parameters per layer and cannot follow every printed MTF sample. Its dependence on local density differences is also assumed.
- The printed antihalation layer is documented, but its strength, radius, layer weights and bloom response are not measured.
- Uneven dye-chart gridlines leave about 1.5 nm of wavelength-axis uncertainty. Only one vector edition is available, with no independent digitisation-error estimate.
- The sheet gives different support thicknesses for 135 and 120 film. This preview uses the 135-format value of 127 µm.
- The physical dye-cloud or grain-clump size is inferred from the film's speed class, not measured for this film.
- Individual dye amounts, layer interactions and push/pull behaviour are approximated where the datasheet provides no calibration. Grain size is assumed; published RMS granularity does not specify dye-cloud size.
- Characteristic response outside the published exposure range is an extrapolation, not measured film data.
- Halation strength, radius and layer weights are not quantified by the datasheet. The effect of removing antihalation and the bloom response are also approximations.
- The available sources do not measure veiling flare during projection. The model approximates its contribution to lifted blacks on screen, so the result is not a measured projection contrast.
Reciprocity: modelled from 1/4000 s to 240 s, following the datasheet's corrections for long and short exposures. Exposure time stops at the ends of that range.
Film guide: assumptions and practical choices
Sources
- Exposure index: FUJICHROME PROVIA 400F Professional [RHPIII] Data Sheet, AF3-066E (EIGI-03.1-HB), p. 1
- Process: FUJICHROME PROVIA 400F Professional [RHPIII] Data Sheet, AF3-066E (EIGI-03.1-HB), p. 3
- Diffuse RMS granularity: FUJICHROME PROVIA 400F Professional [RHPIII] Data Sheet, AF3-066E (EIGI-03.1-HB), p. 5
- Characteristic curves: FUJICHROME PROVIA 400F Professional [RHPIII] Data Sheet, AF3-066E (EIGI-03.1-HB), p. 6